Pronóstico semanal de Forex y análisis de FX 22 - 26 De Marzo

EUR/CHF
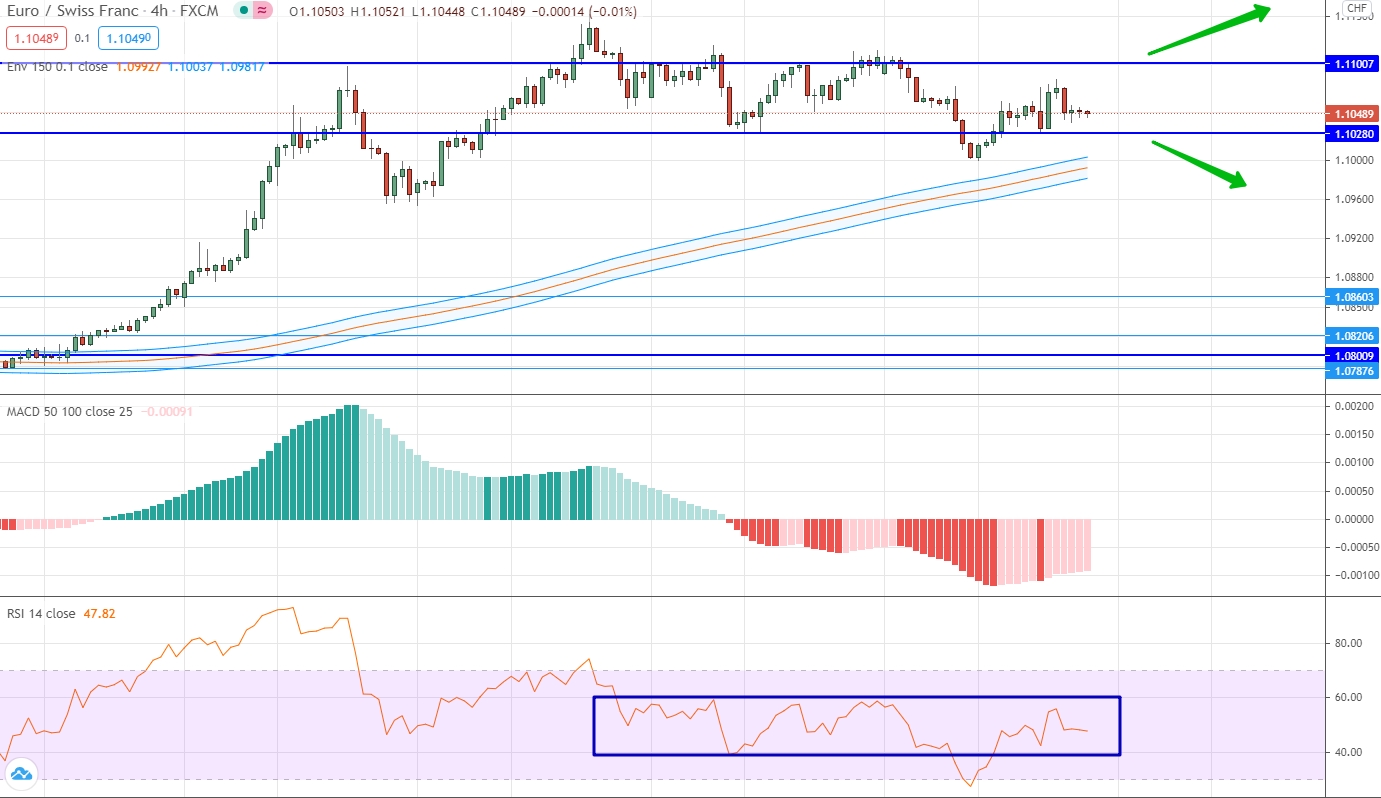
The euro continues to recover against the Swiss franc after the formation of an uptrend with elements of super-volatile trading. The current market situation is characterized by a sideways correction when the price is trapped inside the sideways range of 1.1028 and 1.1100. Interestingly, not only the price has lost its volatility, but the indicators too. All analytical instruments are in neutral positions and do not give signals for trading. Thus, you can simply wait in which direction this trading range will be broken and open a contract in the direction of the breakdown. Given the dominance of the upward trend, an upward movement is most likely.
NZD/USD
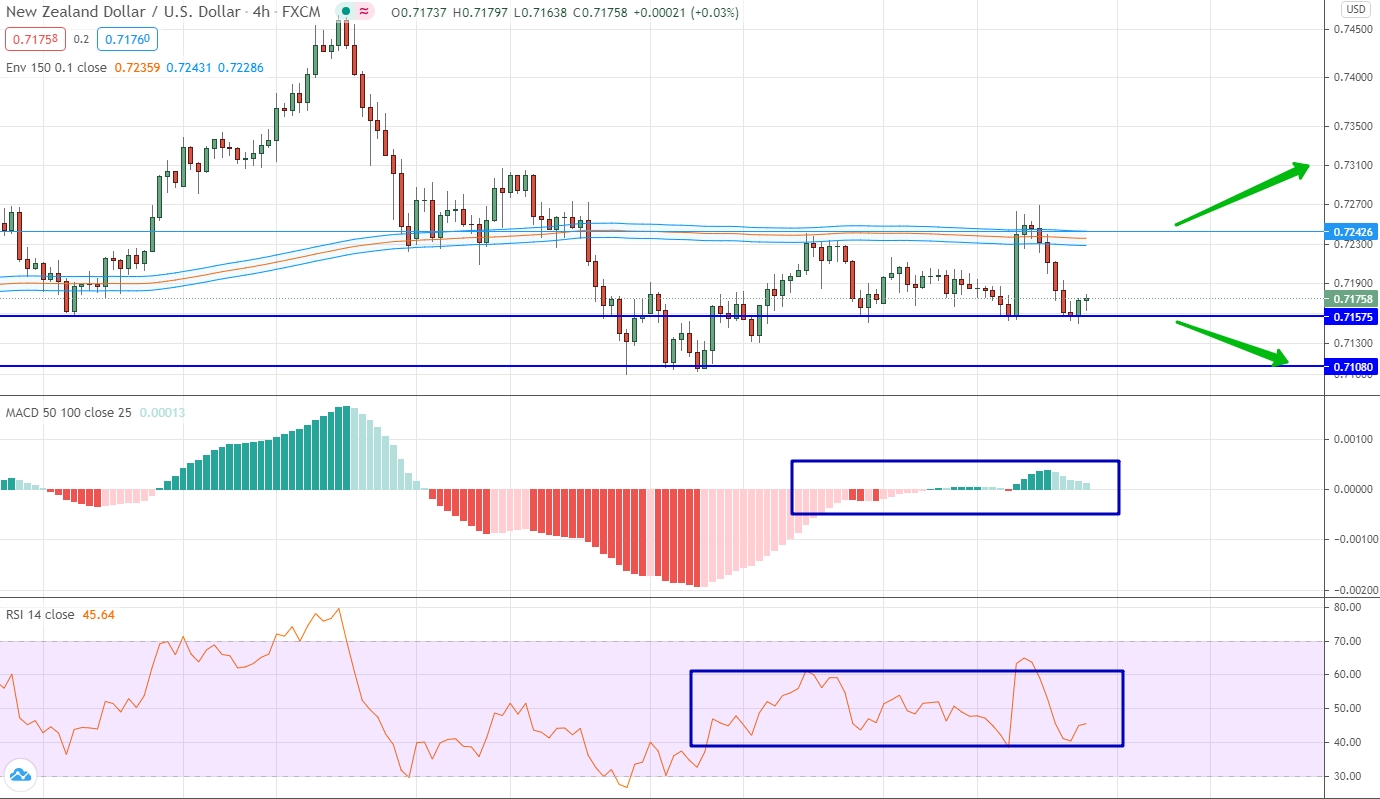
For this currency pair, we can talk about the dominance of sideways dynamics. It is expressed in the presence of a sideways price corridor with the boundaries of 0.7157 and 0.7242. An important characteristic of the upper level is that it absolutely coincides with the levels of the moving averages, which enhances its importance. Neutral dynamics is visible for all indicators that show zero dynamics. Therefore, we are again talking about the fact that you cannot open a contract and you can only wait in which direction the market will start moving.
EUR/RUB
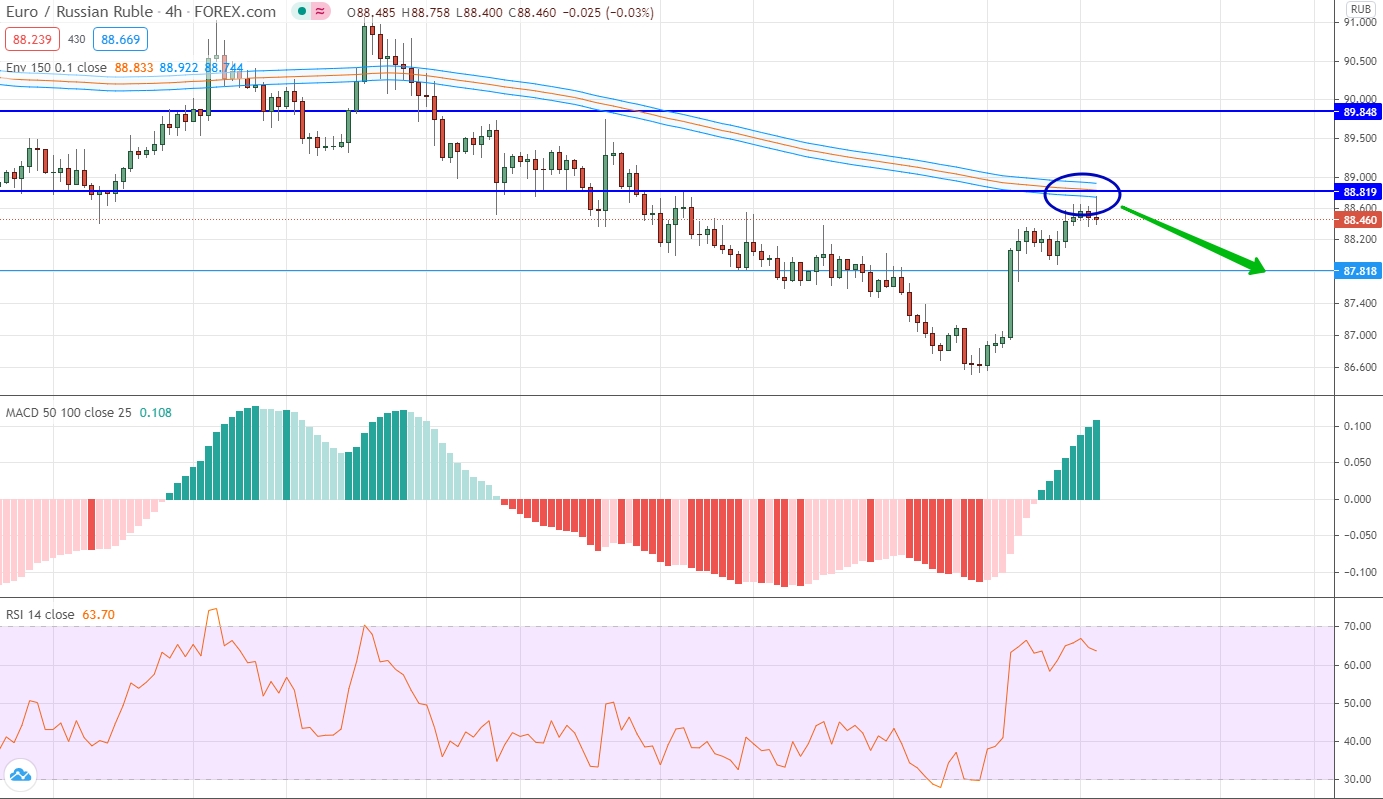
The euro continues to form a downtrend against the Russian ruble. However, the current situation may prove to be a watershed. First of all, we draw your attention to the fact that within the framework of the downward movement, a clear upward correction has formed, which has already reached the level of moving averages and the important level of 8.882. If we assume that this is indeed a corrective upward movement, then the market should again return to the fall, which means that here and now it is possible to open a descending contract. If this movement is not confirmed, then an upward contract can be considered, but only if the price turns out to be above the above level and above the level of the moving averages.
AUD/CHF
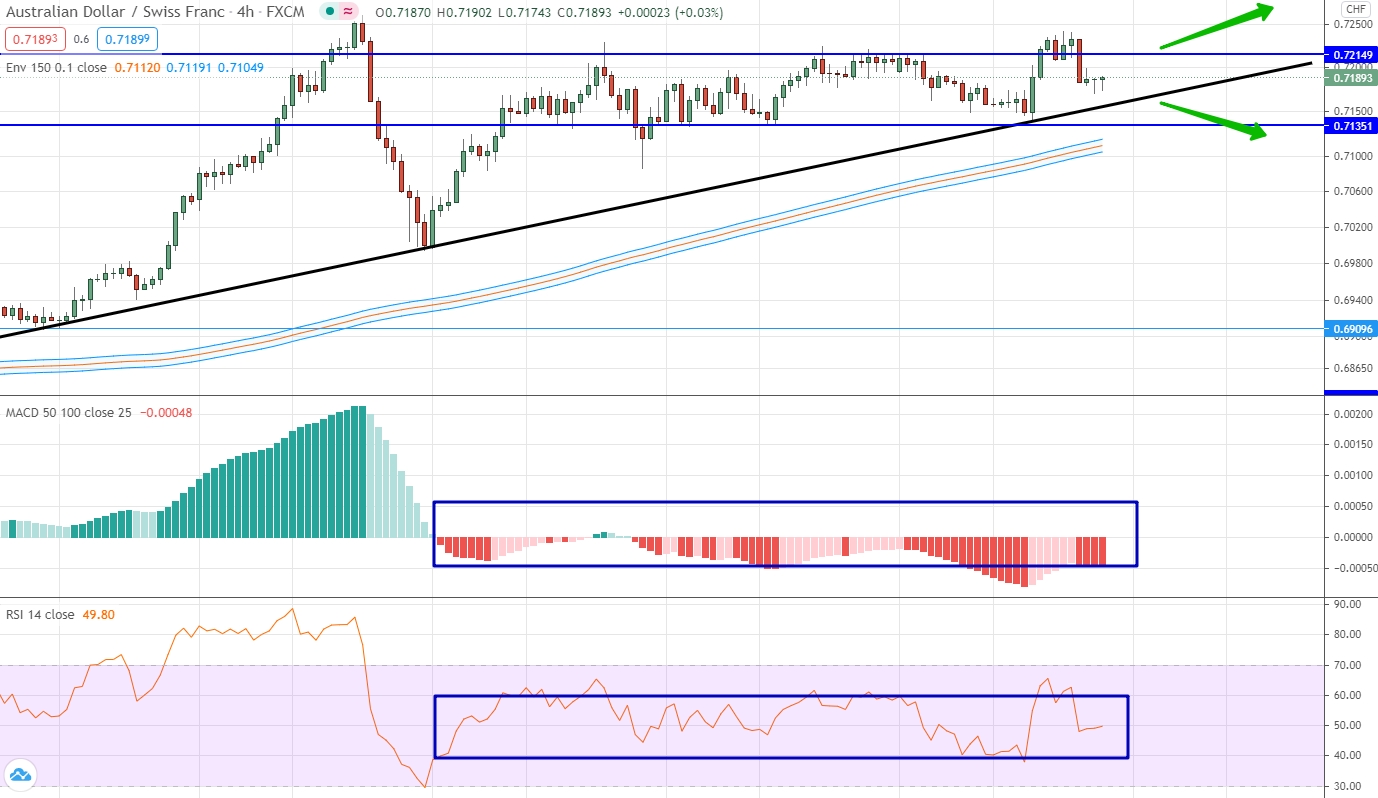
For the Australian dollar against the Swiss franc, the main dynamics are still upward, however, the trading of the last few weeks has been squeezed within the sideways range with the borders of 0.7135 and 0.7215. The indicators also do not give any signals before trading and are in neutral positions confirming the sideways dynamics. Therefore, we wait in which direction this range will be broken and open a contract in the direction of the breakout. An upward movement is most likely. A downtrend contract can be opened if the price is below the trend line indicated on the chart.
GBP/CAD
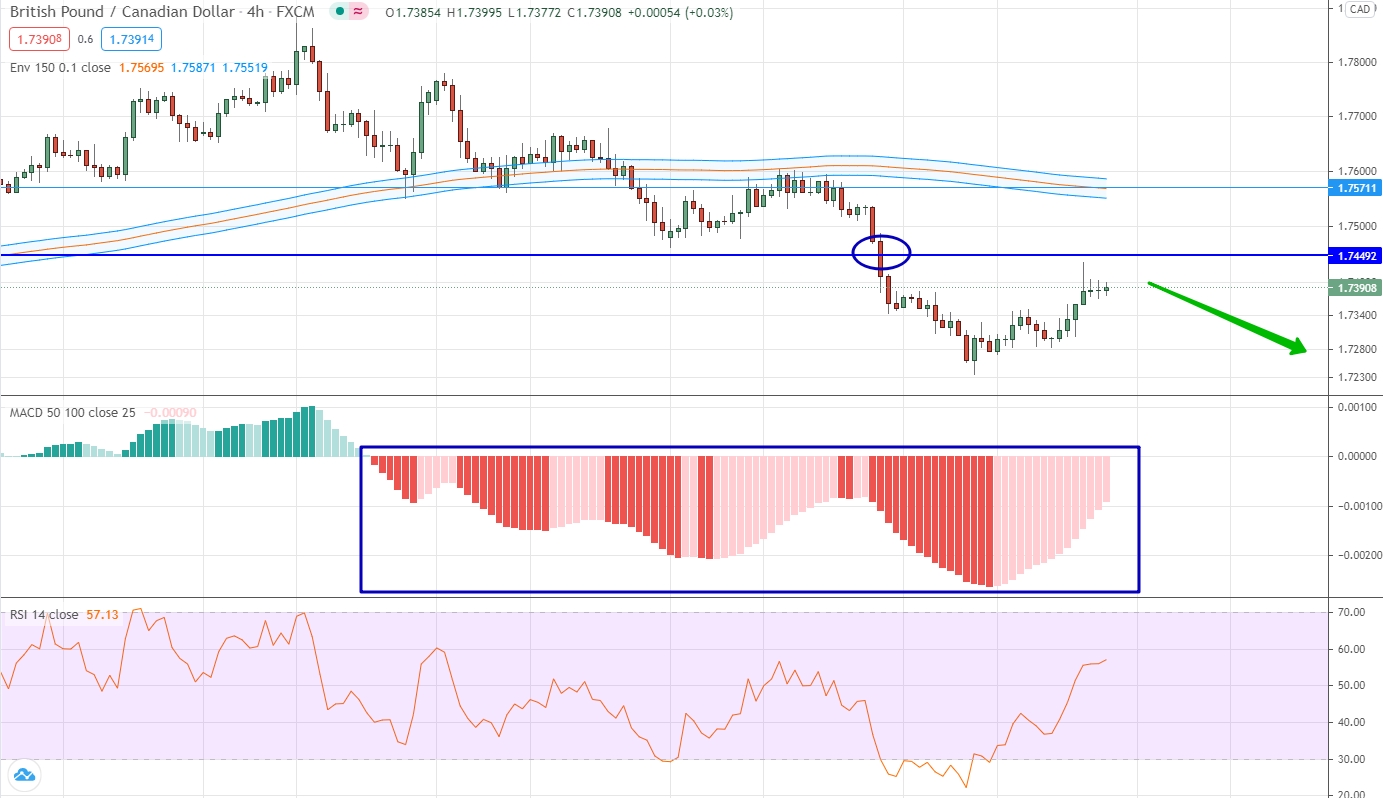
Trading in this underlying asset is characterized by clear downward pressure. This pressure is very clearly visible on the histogram, which is plotted in the negative area and constantly updates its minimum values. If we consider the price chart, then it is very important to note that the market has already consolidated below the important level of 1.7450. Consequently, the downward trend is relevant and dominates. Taking into account the fact that we have seen a correction in recent days, which has practically risen to an important level, we can open a contract for a fall.
NZD/CHF
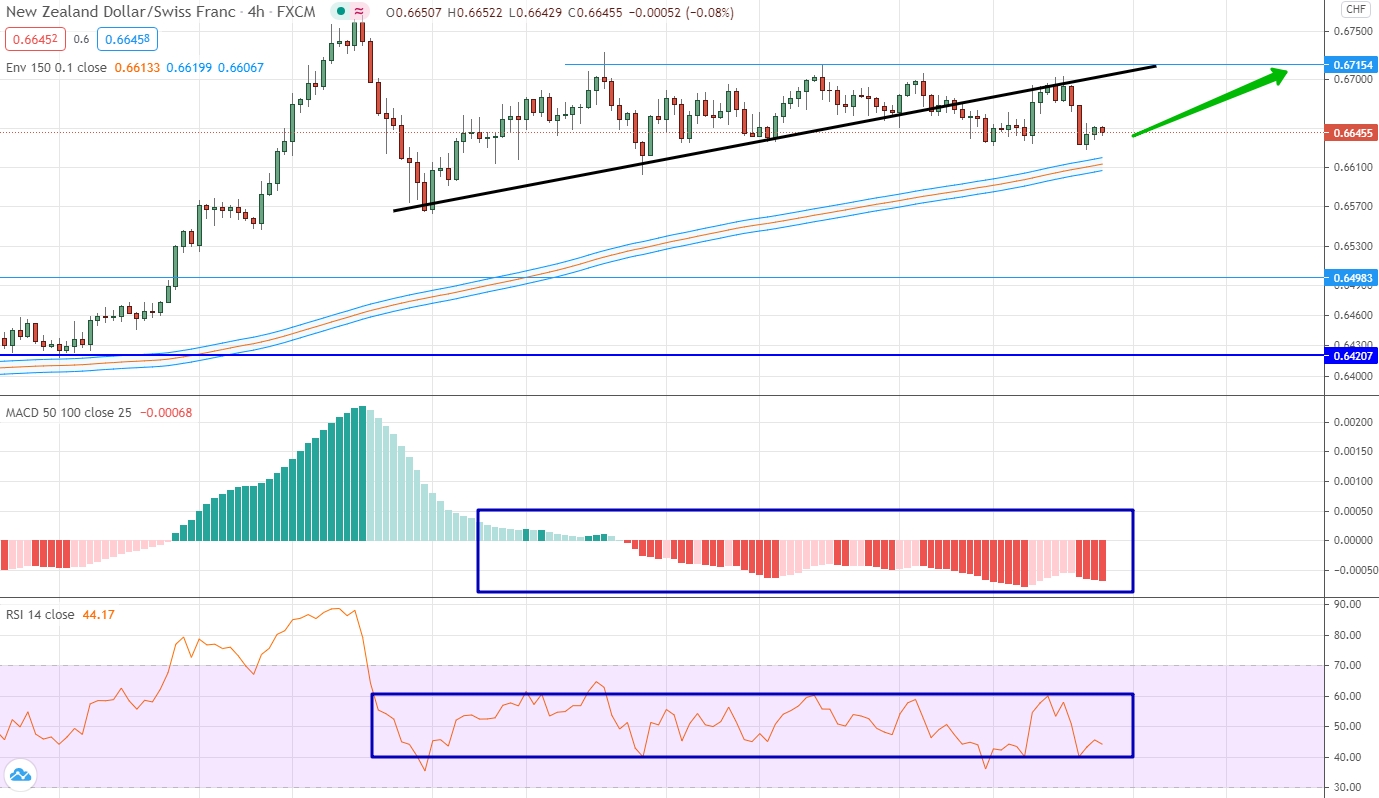
The New Zealand dollar against the Swiss franc is globally characterized by uptrend pressure, but locally we are talking about sideways dynamics, which is capped at the top by the 0.6715 level, and below by the moving averages. As for the indicators, they confirm the sideways dynamics, since they are close to their neutral values and are not strongly separated from them. Taking into account that the price turned out to be below the local trend line and has already reached the level of the moving averages, we can expect an upward movement to the area of a strong level.
USD/CNH
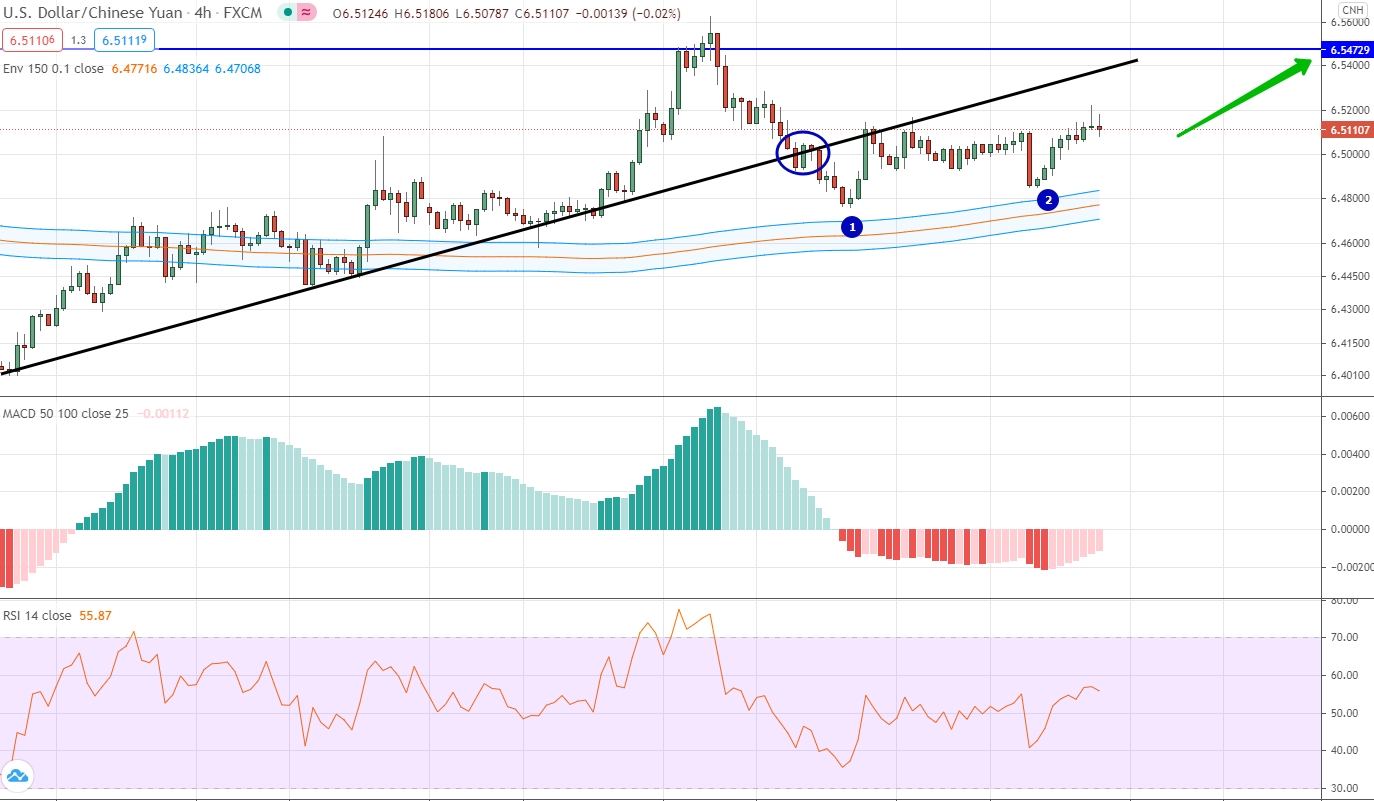
The US dollar continues to try to form an uptrend against the Chinese yuan. It is very important that the price of this currency pair is already trading above the level of the moving averages, and the averages themselves have changed their slope to an upward one. At the same time, if we consider the price chart, then the market twice tested the moving averages from top to bottom, and then bounced up. In theory, this speaks of the strength and potential of the upward movement. Therefore, we can consider options for trading up, but we take into account that there is a very important level 6.5473 on top.
